
A while ago I was asked by a client how to author management packs with Powershell monitors and discoveries. It is actually not too hard to do, but the steps are quite lengthy….
In the Authoring Console click the New… Management Pack button.

On the Select a management pack template page select Empty Management Pack and enter Example.Powershell.Services in the Management Pack Identity field. Click Next.

On the Enter the name and description for the management pack page enter Example Powershell Services Monitoring.
In the Display Name field and optionally enter a description in the Description field. Click Create.

Navigate to the Service Model section of the Authoring Console and select Classes. Right click in the Classes pane and select New -> Windows Local Application.

In the Windows Local Application wizard on the General page, enter Example.Powershell.Services.Class in the ID field. Enter Example Powershell Service Class in the Display Name field and optionally enter a description in the Description field. Click Next.

On the Key Properties page click Finish without entering any information.

In the Classes pane right Click the Example.Powershell.Services.Class and select Properties.

Select the Properties tab and right click in the left field. Select Add Property.

On the Choose a unique identifier… page enter ServiceName and click OK.

On the Properties tab enter Service Name in the Display Name field, enter Service Name in the Description field and check the Key check box.

Navigate to the Health Model section of the Authoring Console and select Discoveries. In the Discoveries pane right click and select New -> Custom Discovery…

On the Choose a unique identifier… page enter Example.Powershell.Services.Discovery and click OK.

On the General tab enter Example Powershell Service Discovery in the Name field. Click the “…” button next to the Target drop down box.

On the Management Pack Class Chooser enter server in the Look for field and select the Microsoft.Windows.Server.Computer class. Click OK.

On the Discovered Classes tab click the Add button and repeat step 7 only selection Example.Powershell.Service.Class instead of Microsoft.Windows.Server.Computer.

On the Configuration tab click the link Browse for a type…

On the Choose module type enter powershell in the Look for field and select Microsoft.Windows.TimedPowershell.DiscoveryProvider. Enter DS in the Module ID field. Click OK.

The Configuration tab should now display configuration fields. On the Configuration tab click the Edit… button.

In the Notepad file that is launched, add the lines:
<Parameters>
<Parameter>
<Name>strSourceID</Name>
<Value></Value>
</Parameter>
<Parameter>
<Name>strManagedEntityID</Name>
<Value></Value>
</Parameter>
<Parameter>
<Name>strPrincipalName</Name>
<Value></Value>
</Parameter>
</Parameters>
between the xml tags </ScriptBody> and <TimeoutSeconds> and save the file (ctrl – S) and close the file.

Fill the Configuration fields with
the values as shown in the screenshot (and table) and click the Edit… button once completed. NOTE: For readability the values are added to a table hereunder.
| Name | Value |
| IntervalSeconds | 120 |
| SyncTime | 00:00 |
| ScriptName | ServiceDiscovery.ps1 |
| ScriptBody | |
| Parameters | |
| >Parameter | |
| >>Name | strSourceID |
| >>Value | $MPElement$ |
| >Parameter | |
| >>Name | strManagedEntityID |
| >>Value | $Target/Id$ |
| >Parameter | |
| >>Name | strPrincipalName |
| >>Value | $Target/Property[Type=”Windows!Microsoft.Windows.Computer”]/PrincipalName$ |
| timeoutSeconds | 300 |

On the Configuration tab click the Edit… button again. Between the <ScriptBody></ScriptBody> tag enter the Powershell script shown below. Once done press ctrl –S to save the text file. Close the text file.
param($strSourceID,$strManagedEntityID,$strPrincipalName)
$api = new-object -comObject
‘MOM.ScriptAPI’
$discoveryData =
$api.CreateDiscoveryData(0, $strSourceID, $strManagedEntityID)
$api.LogScriptEvent(‘ServiceDiscovery.ps1′,10,4,”starting
Service Discovery Powershell Script”)
Foreach($Service in
Get-Service)
{
$instance =
$discoveryData.CreateClassInstance(“$MPElement[Name=’Example.Powershell.Services.Class’]$”)
$instance.AddProperty(“$MPElement[Name=’Windows!Microsoft.Windows.Computer’]/PrincipalName$”,
$strPrincipalName)
$instance.AddProperty(“$MPElement[Name=’Example.Powershell.Services.Class’]/ServiceName$”,
$Service.Name)
$instance.AddProperty(“$MPElement[Name=’System!System.Entity’]/DisplayName$”,
$Service.DisplayName)
$discoveryData.AddInstance($instance)
}
$discoveryData

Close the Example.Powershell.Services.Discovery by clicking OK.

By default there is no predefined monitor type available in the authoring console. For this reason we will have to author our own Powershell monitor type.
In the Authoring console navigate to the Type Library section and select Monitor Types. Right click in the Monitor Types page and select New -> Composite Monitor Type…

On the Choose a unique identifier… page enter Example.Powershell.Services.Powershell.MonitorType and click OK.

On the General tab enter Powershell Monitor Type in the Name field. Click The States Tab.

On the States tab make sure the 2 State Monitor Type radio button is selected. Enter Healthy in the ID of state1 field and enter Critical in the ID of state 2 field. Select the Member Modules tab.

On the Members Modules tab click the Add… button.

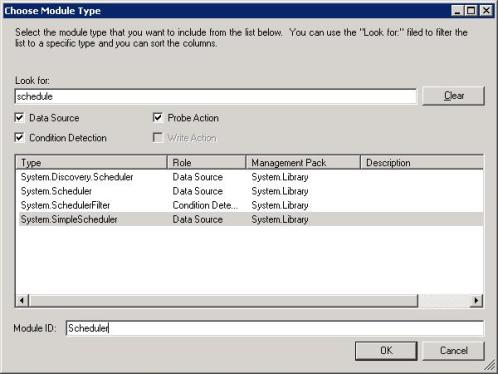
On the Choose Module Type page enter schedule in the Look for field and Select System.SimpleScheduler. In the Module ID field enter Scheduler. Click OK.
On the Scheduler – System.SimpleScheduler page remove any value in the Value columns. Then for both columns locate the arrowbutton and select Promote… After doing this the page should look like the screenshot. Click OK.

On the Members Modules tab click the Add… button again.
On the Choose Module Type page enter powershell in the Look for field and Select Microsoft.Windows.PowershellPropertyBagProbe. In the Module ID field enter PoweshellProbe. Click OK.
On the PowershellProbe – Microsoft.Windows.PowershellPropertyBagProbe page remove any value in the Value columns. Then for both columns locate the arrowbutton and select Promote… After doing this the page should look like the screenshot. Click OK.

On the Members Modules tab click the Add… button again.
On the Choose Module Type page enter expression in the Look for field and Select System.ExpressionFilter. In the Module ID field enter HealthExpression. Click OK.
On the HealthyExpresion – System.ExpressionFilter click the edit button and remove all xml between the <Expression></Expression> tags. Press crtl – s and close the notepad.

On the HealthyExpresion – System.ExpressionFilter do not edit any of the fields (we will return to this later) and click OK.

On the Members Modules tab click the Add… button again.
On the Choose Module Type page enter expression in the Look for field and Select System.ExpressionFilter. In the Module ID field enter CriticalExpression. Click OK.
On the CriticalExpresion – System.ExpressionFilter click the edit button and remove all xml between the <Expression></Expression> tags. Press crtl – s and close the notepad.

On the CriticalExpresion – System.ExpressionFilter do not edit any of the fields (we will return to this later) and click OK.

On the Members Modules tab click the Add… button again.
On the Choose Module Type page enter pass in the Look for field and Select System.PassThroughProbe. In the Module ID field enter PassThrough. Click OK twice.
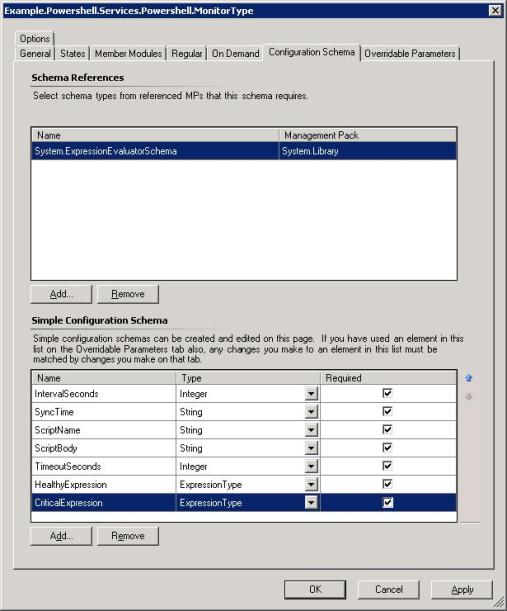
The Example.Powershell.Service.Powershell.MonitorType page should now look as in the screenshot. Select the Configuration Schema tab.

On the Configuration Schema tab click Add… in the Schema References section.

In the Look for field of the Include Schema Type page enter expression. Select System.ExpressionEvaluatorSchema and click OK.

On the Configuration Schema tab click Add… in the Simple Configuration Schema section.

On the Please enter the requested value… page enter HealthyExpression. Click OK.

On the Configuration Schema tab click Add… in the Simple Configuration Schema section.
On the Please enter the requested value… page enter CriticalExpression. Click OK.
On the Configuration Schema tab under the Simple Configuration Schema section set the values in the Type column as shown in the screenshot.
Click the Member Modules tab.
On the Member Modules tab select the HealthyExpression module and click Edit.

On the HealthyExpresion – System.ExpressionFilter page remove any value in the Valuecolumns. Locate the arrowbutton and select $Config/HealthyExpression$. Click OK.

On the Member Modules tab select the CriticalExpression module and click Edit.
On the CriticalExpresion – System.ExpressionFilter page remove any value in the Value columns. Locate the arrowbutton and select $Config/CriticalExpression$. Click OK. Select the Regular
tab.
On the Regular tab make sure the Healthy row is selected in the State column. Configure the settings as shown in the screenshot.

On the Regular tab make sure the Critical row is selected in the State column. Configure the settings as shown in the screenshot.

On the On Demand tab check the Use On Demand Detection check box, make sure the Healthy row is selected in the State column. Configure the settings as shown in the screenshot.

On the On Demand tab check the Use On Demand Detection check box, make sure the Critical row is selected in the State column. Configure the settings as shown in the screenshot. Click OK.

Click Schema Types and right click in the Schema Types pane. Select New -> New Schema Type.

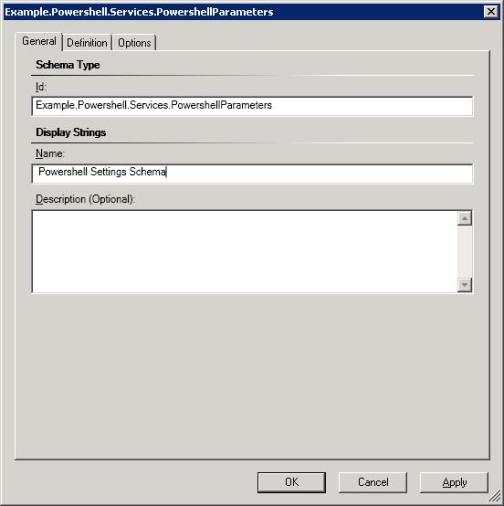
On the unique identifier… page enter Example.Powershell.Services.PowershellParameters and click OK.

On the Example.Powershell.Services.PowershellParameters page enter Powershell Settings Schema in the Name field and click the Definition tab.
Enter the following xml in the Schema field on the Definition tab and click OK.<xsd:complexType xmlns:xsd=”http://www.w3.org/2001/XMLSchema”
name=”PowerShellSettingsType”><xsd:sequence><xsd:element
minOccurs=”1″ maxOccurs=”unbounded”
name=”Parameter”><xsd:complexType><xsd:sequence><xsd:element
name=”Name” type=”xsd:string” /><xsd:element
name=”Value” type=”xsd:string”
/></xsd:sequence></xsd:complexType></xsd:element></xsd:sequence></xsd:complexType>
Go back to the Monitor Types and select the properties from the Example.Powershell.Services.Powershell.MonitorType.

Click the configuration Schema tab and click Add in the Schema References section.
On the Include Schema Type page select Example.Powershell.Services.PowershellParameters and click OK.

Click the configuration Schema tab and click Add in the Simple Configuration Schema section.
On the Please enter the requested value… page enter Parameters and click OK

.In the Simple Configuration Schema section locate the parameters row. In the Type column next to Parameters select PowershellSettingsType from the drop down box.

Select the Member Modules tab and select the PowershellProbe module and click edit.
On the PowershellProbe – Microsoft.Windows.PowershellPropertyBagProbe page click edit.
In the Notepad document enter the following line after the </ScriptBody> tag:<Parameters></Parameters>press ctrl-s and close the notepad document. If you receive an error message click Ignore.

On the PowershellProbe – Microsoft.Windows.PowershellPropertyBagProbe click thesymbol next to Parameters and select $Config/Parameters$. Click OK twice.

We have now defined a Powershell monitor type and are able to create a powershell monitor..
In the Authoring console navigate to the Health Model section and select Monitors. Right click in the Monitors page and select New -> Custom Unit Monitor…

On the Choose a unique identifier… page enter Example.Powershell.Services.ServiceMonitor and click OK.

On the Example.Powershell.Services.ServiceMonitor page select the General tab and enter Service Monitor in the Name field. In the Target drop down box select Example.Powershell.Services.Class. In the Parent Monitor drop down box select System.Health.AvailabilityState. Click The Configuration tab.

On the Configuration tab click the link. On the Choose unit monitor type page select Example.Powershell.Services.Powershell.MonitorType and click OK.

On the Configuration tab click the Edit… button and insert the following xml between the <Configuration p1:noNamespaceSchemaLocation=””…………..></Configuration> tags and press ctrl-s and close the notepad.
<IntervalSeconds>60</IntervalSeconds>
<SyncTime>00:00</SyncTime>
<ScriptName>ServiceMonitor.ps1</ScriptName>
<ScriptBody>
param($ServiceName)
$api = new-object -comObject ‘MOM.ScriptAPI’
$bag = $api.CreatePropertyBag()
$Service = Get-Service $ServiceName
$api.LogScriptEvent(‘ServiceMonitor.ps1’,20,4,$ServiceName)
$bag.AddValue(‘ServiceState’, $Service.Status)
$bag
</ScriptBody>
<TimeoutSeconds>300</TimeoutSeconds>
<HealthyExpression>
<SimpleExpression>
<ValueExpression>
<XPathQuery
Type=”String”>Prorperty[@Name=’ServiceState’]</XPathQuery>
</ValueExpression>
<Operator>Equal</Operator>
<ValueExpression>
<Value Type=”String”>4</Value>
</ValueExpression>
</SimpleExpression>
</HealthyExpression>
<CriticalExpression>
<SimpleExpression>
<ValueExpression>
<XPathQuery
Type=”String”>Property[@Name=’ServiceState’]</XPathQuery>
</ValueExpression>
<Operator>Equal</Operator>
<ValueExpression>
<Value Type=”String”>1</Value>
</ValueExpression>
</SimpleExpression>
</CriticalExpression>
<Parameters>
<Parameter>
<Name>ServiceName</Name>
<Value>$Target/Property[Type=”Example.Powershell.Services.Class”]/ServiceName$</Value>
</Parameter>
</Parameters>
The xml in the notepad should be the same as in the screenshot:

The Configuration tab should now look as in the screenshot:

Click the Health tab and set the Healthy Monitoring Condition to Healthy in the Health State column. Set the Critical Monitoring Condition to Critical in the Health State column.

Click the Alerting tab and check the Generate alerts for this monitor check box. On the Generate an alert when dropdown box select The monitor is in a critical health state. In the Alert name field enter Service Monitor. In the Alert description field enter the text hereunder and click OK.
The service $Target/Property[Type=”System!System.Entity”]/DisplayName$ on server $Target/Host/Property[Type=”Windows!Microsoft.Windows.Computer”]/PrincipalName$ is in a stopped state.

Navigate to the Presentation section of the Authoring Console. Select Views and right click in the Views pane selection New -> Folder…

On the Choose a unique identifier… page enter Example.Powershell.Services.ViewFolder and click OK.

On the Example.Powershell.Services.ViewFolder page enter Powershell Service Example in the Name field and click the Folder tab.

On the Folder tab make sure only the Microsoft.SystemCenter.Monitoring.ViewFolder.Root is selected. Click OK.

Select Views and right click in the Views pane selection New -> State View.
On the State View page enter Example.Powershell.Services.StateView in the Element ID field. Enter Service State in the Display Name field. Select Example.Powershell.Services.Class
from the Target Dropdown box. Select AvailabilityHealth from the Category dropdown box. Click Finish.

Right Click the Example.Powershell.Services.StateView and select Properties.

Select the Folder tab and make sure only the Example.Powershell.Services.VeiwFolder is selected.


Nice post. Is it possible to create an attribute, and populate the value with a powershell script? I would like to extend the windows computer class with a “ManagedBy” attribute, then populate the filed with the “Managedby” value in active directory.
I would love to see a post on how to accomplish this.
Hi Mike,
The act of creating an extension attribute is actually the same as making a new (custom) class. See:
http://blogs.msdn.com/b/steverac/archive/2011/09/16/extending-a-class-in-the-authoring-console.aspx
I guess you would be able to pre-make the custom class and populate the class with the powershell discovery. Let me see if I can take some time to capture it in a blog.
I have tried to create a MP that extends the windows computer class with a “ManagedBy” field a couple of times now. I tried with the SCOM 2007 authoring console and with VSAE. Could you write a blog post on how to extend the Windows Computer class with the managedby filed in Active Directory?
One Thousand Thank You’s in advance!!
Hi Mike,
Usually you would extend the Windows Computer Class by going to the Authoring section of the SCOM Console and selecting Management Pack Objects -> Attributes. The right click Attributes and select “Create New Attribute…”. You can the save the extension attribute in your management pack of choice.
If you would like to use the VSE then visit this link: http://blogs.technet.com/b/emreguclu/archive/2012/11/07/extending-windows-computer-class-using-visual-studio-authoring-extensions-vsae.aspx
– HTH